Patient Experience Surveys report
See how many patient experience (PREMS) surveys were completed for each service over a period, and export a service's responses as a CSV.
The Patient Experience Surveys report shows how patients responded to the experience survey on their encounter, grouped by service, so you can see response rates in one place and pull the responses out for a service.
Use it to spot common feedback – what patients raise repeatedly about a service, and where the experience could be better.
The report groups responses by service rather than by team member. A response can still be traced back to the encounter it came from, and from there to the people involved, so treat what you find as a prompt to improve how the service runs rather than as a review of an individual.
How the survey reaches the patient
There's no send step. Where a patient experience survey is configured on a service, Light includes it in the post-service email the patient gets when you complete the encounter, as a button that opens the survey for them.
The survey only goes out on services it's configured on, and it drops out of the email once the patient has submitted it.
If your pharmacy is part of a group, services and their surveys are often configured centrally. The survey link can also be passed to the group's own system when you complete an encounter, so in some groups the patient is sent the survey from there rather than by Light. Either way it's the same survey, and the responses come back into this report.
Speak to your Head Office to find out how it's set up for a service, or to ask for it.
What the report shows
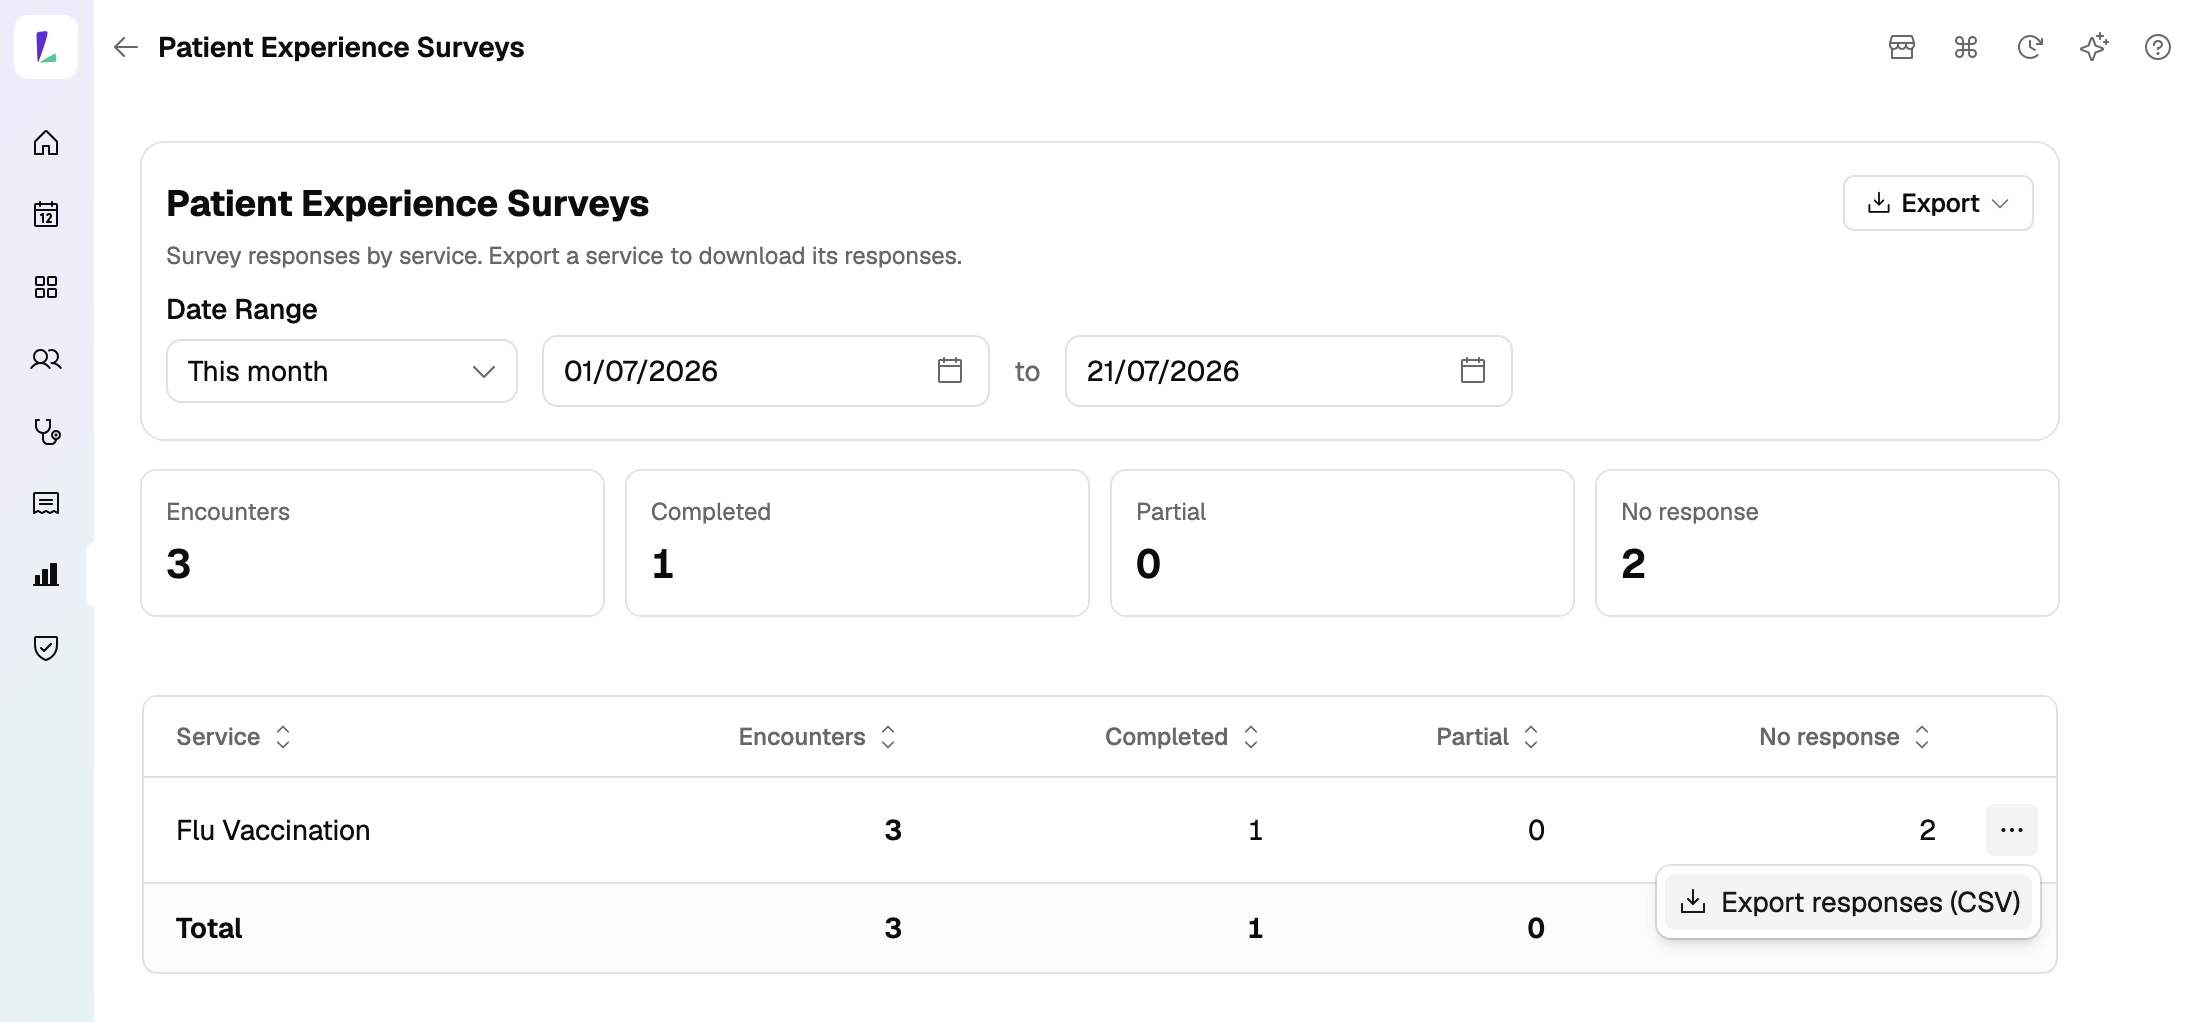
Four totals sit at the top – Encounters, Completed, Partial, and No response – followed by a table with one row per service and the same counts, with a total row at the bottom.
- Encounters – encounters in the period with a survey on them.
- Completed – the patient submitted the survey.
- Partial – the patient started but didn't submit.
- No response – the survey went out and nothing came back.
Tap any column heading to sort. The table sorts by Encounters by default, highest first.
Exporting a service's responses
The Export button at the top gives you the per-service counts – the table as you see it.
For the responses themselves, open the menu on a service's row and choose Export responses (CSV). You get one row per completed survey, with a column per question. Only completed surveys are included, so the option does nothing for a service with none in the period.
Each file names the service on every row, so you can export several services and combine them.
Response exports carry no patient names, but each row has a submission date and time – which can be enough to trace a response back to an encounter where volumes are low. Treat the file with care, and safely discard it once you no longer need it.
Changing the date range
Use the date controls at the top. The report defaults to This month. See Viewing reports for the shared controls.